Navigating the current market, no one wants to be overexposed to AI and tech simply because the valuations are remarkably high, but I am actively looking to optimize the exposure I do have. Sitting on the sidelines while tech runs isn’t my style, especially when income-focused vehicles can participate in the upside while cushioning the down days. Living in California, I’m surrounded by the persistent buzz of tech innovation, which often means witnessing extreme volatility firsthand. I’ve learned that the key to long-term success isn’t avoiding tech, but learning how to harvest its growth into consistent, investable income.
Today, we are diving deep into a comparison of two heavy-hitting, actively managed funds that claim to do just that: the Amplify CWP Growth and Income ETF (QDVO) and the Curve Technology Titans Select ETF (KQQQ). The transcript refers to KQQQ as Kleq—a necessary change since ‘QQQ’ sounds a bit too much like a Sheriff Rosco catchphrase from The Dukes of Hazzard.
These two funds pay substantial yields and, impressively, have outpaced the NASDAQ 100 for total return recently. This is a very difficult feat for an income fund to accomplish, as income strategies usually require trading away some capital appreciation. By examining their distributions, how they generate income, and their respective total returns, this analysis will help you decide if you want to own either fund, or perhaps both.
Distributions and Income: Understanding the Cash Flow Range
Let’s start where every income investor does: the distributions. These aren’t your grandfather’s fixed-income payouts. The income generated by QDVO and Kleq varies every month because they are tied to actively managed option strategies. It’s best to view the yield as a fluctuating range rather than a guaranteed number.
QDVO’s Steady Payout Trends
QDVO is currently yielding 9.7% if we use a trailing 12-month (TTM) formula, and 10.9% if you annualize the most recent distribution. This yield has mostly trended upward. Why? Because the underlying portfolio used to generate that income has also trended up in value. Remember, an increase in portfolio assets generally means the fund can sell larger options contracts, harvesting larger premiums. They also historically distribute excess income in December, which is something to watch for again in 2025.
If you are new to the Dannywrites universe, I retired back in 2017, which is when I dedicated myself to deep investment research. This space is where I share what I learn. My main focus is on stocks and funds paying consistent yields in the 8% to 12% range.
Kleq (KQQQ): From Launch to a Stable 16% Target
Switching focus to Kleq, the income history has been more volatile, but in a very positive way. It started small with modest 15-cent monthly payouts but shot up until it settled in the 40-cent range per month. In an interview I conducted with Howard (a representative of the fund), he clarified that it took the new fund about six months to find stability. Howard stated their expected sustainable yield is actually in the 15% to 16% range, meaning the 17% recorded at the time of the transcript was slightly higher than their target.
Tracking these complex payout calendars across multiple brokerages can be a headache. While my transcript used Snowball to visualize dashboards and rank yields for rebalancing, I rely on rigorous analysis and data comparison to maintain my portfolio’s flow of dollars. Knowing how many dollars will arrive on any given day is paramount for maintaining the retirement lifestyle.

Under the Hood: How They Actively Make Money
Understanding how QDVO and Kleq function requires understanding active management, which can be broken down into stock selection and option trading strategy. It is critical to grasp how these mechanics work before adding them to your core holdings.
Active Stock Selection Beyond the NASDAQ 100
Active stock selection differentiates these funds from passive index trackers. QDVO’s top eight holdings look very similar to the tech names dominating growth portfolios (the largest NASDAQ 100 components). However, if we zoom out, QDVO holds significant concentrations in off-index names. For example, Visa is holding the number nine position (listed on the NYSE, not the NASDAQ). They also hold pharmaceutical giant Eli Lilly. QDVO is highly concentrated with just under 50 stocks—less than half the holdings of the NASDAQ 100.
Kleq (Curve Technology Titans Select ETF) is even more concentrated, focusing its capital on only 15 to 25 stocks in the active portfolio. The total holdings list is closer to 50, but roughly half of those positions are cash and options. Kleq holds typcial tech stocks, but with different weightings. It is heavier on Alphabet and lighter on Nvidia than QDVO or the NASDAQ 100. Critically, it holds names not listed on the NASDAQ 100, including Uber, IBM, and Spotify.
Furthermore, Kleq holds a huge chunk of cash and treasuries because they use synthetic price replication for some positions. This means instead of holding the actual stock, they hold a put and a call option, ensuring the net value moves in line with the stock’s price, while the cash acts as collateral for those options.
Option Trading Mechanics: Generating Payouts at the Expense of Upside
The second aspect of the active management engine is the option trading itself. These tech stocks pay little to no dividend income. The funds generate distributions almost exclusively by selling (writing) covered calls. Each call sold generates immediate cash but also gives away some of the asset’s potential upside.
The managers must constantly balance income against appreciation. To increase distributions, they can write more options, adjust the duration (usually the 30- to 45-day window is preferred), or sell options that are closer to the current market price of the asset (selling ‘at-the-money’ rather than ‘out-of-the-money’).
Checking Seeking Alpha is part of my daily routine; I don’t buy an asset without thorough due diligence. In comparing the two, Kleq’s overall option strategy is clearly focused on achieving more income and sacrificing more appreciation than QDVO.
The Total Return Showdown: Theory vs. Practice
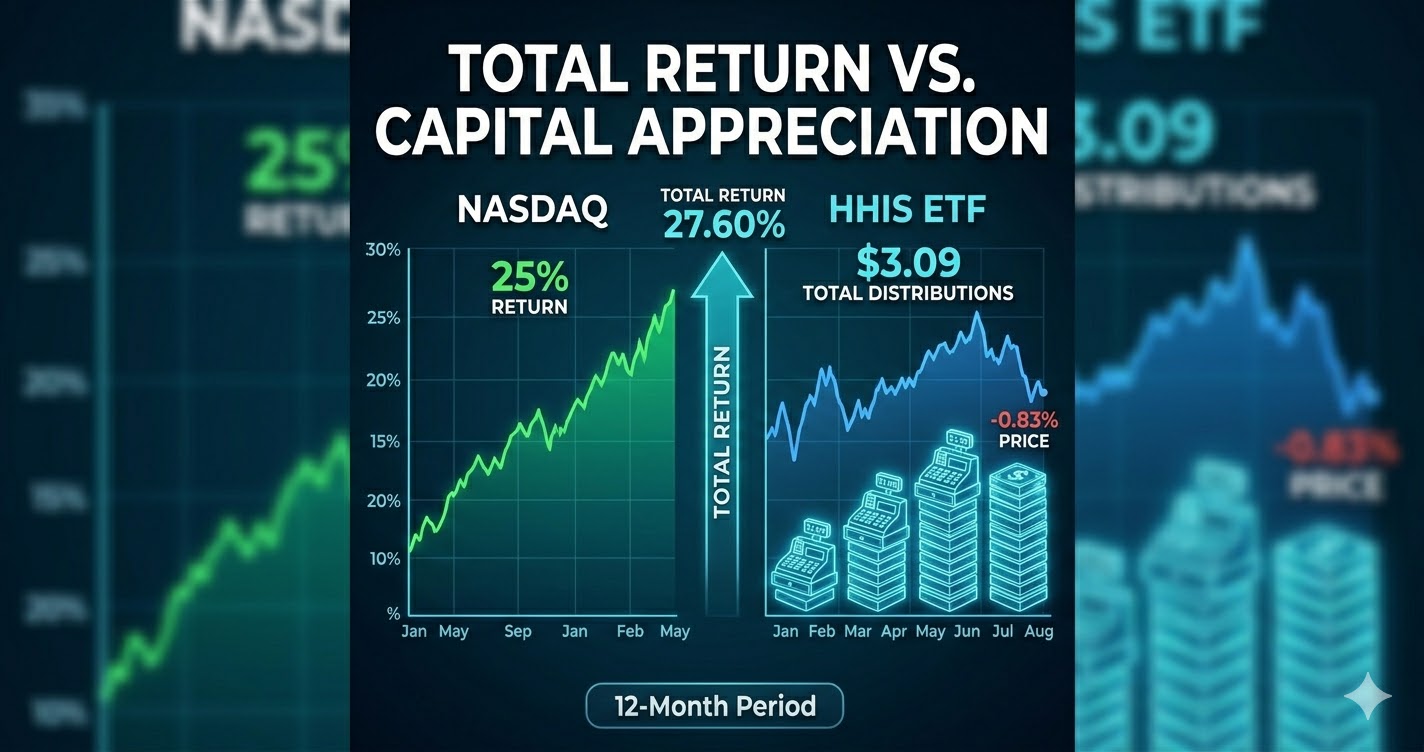
Of course, income is only part of the story. A complete comparison incorporates price appreciation on a total return chart. Let’s look at the performance data since August 2024 (the launch date of QDVO, the newer of the two).
Comparing Post-April 2025 Performance
When looking strictly at price, Kleq caught up to QDVO after lagging initially, but fell behind again more recently. This is not surprising given Kleq’s intense income focus. Over this period, Kleq lagged by 4.6% in price. However, when we include the substantial distributions on a total return chart, the gap narrows significantly from 4.6% down to just 2.2% behind QDVO.
So, does this imply QDVO is the superior fund? It isn’t that simple for three distinct reasons:
- Distribution Timing: We must remember Kleq’s payout chart. It started with very small distributions (those 15-cent payouts), meaning it hasn’t had a full year of maximum payout history factored in equally.
- Protective Puts: Howard clarified that Kleq uses protective puts to reduce downside risk during a correction. These are essentially insurance policies the fund buys. Puts cost money and can drag on performance if a correction doesn’t occur.
- Modified Strategy: Curve modified its option strategy after the April correction, adjusting the price sensitivity of the synthetic options to allow for more room for appreciation.
While it is too early to tell if this strategic modification will lead to long-term performance improvements, the results so far are positive. Looking strictly at total return data post-tariff sell-off (the past six months), Kleq is the clear leader.

Taxes and Fees: The Fine Print that Matters
Taxes and fees represent a silent but powerful drag on any portfolio. Understanding how QDVO and Kleq are managed from a tax efficiency and expense standpoint is vital for long-term holders.
QDVO is the winner regarding stated expenses, carrying an expense ratio of just 0.55%—remarkably low for a fund that actively manages both a concentrated stock portfolio and a covered call strategy. Kleq deductions are more complex, but the net deduction taken before they calculate the yield is 0.92%. This gives QDVO a significant 0.37% fee advantage.
Tax Efficiency or Fee Advantage?
Tax efficiency constantly changes, but based on the available data, Kleq appears to be more tax efficient. An 8937 tax form provided by Curve shows that more than 85% of distributions were categorized as return of capital (ROC). QDVO estimates via 19 A1 forms showed a 96% return of capital estimation.
However, I tend to trust finalized forms over estimates. The only finalized tax statement I found on the Amplify website (covering the final four months of 2024) showed only 10.7% of distributions during that period as return of capital. Most was regular ordinary income. It’s possible the estimates are correct for 2025, but I wouldn’t assume so until the official tax forms are available.

Final Verdict: Why I Am Chosen to Hold Both
I would be perfectly happy with a tech income fund that trails the NASDAQ 100 slightly or matches it. Beating it—which both funds are currently accomplishing—is a massive bonus. Regular, high income combined with long-term appreciation potential makes these actively managed tech funds extremely attractive to my income-focused strategy.
The significant downside is that during a major tech correction, these funds will obviously get hit extremely hard. And as the value of the active portfolios falls, the value of the calls written (and therefore the distributions) will fall correspondingly.
My chosen path is to hold both QDVO and Kleq. While there is unavoidable overlap in their underlying portfolios, there is significant diversification in their strategies. If one outperforms in a raging bull market and the other handles choppy or bear markets more effectively, I am content. I will continue to hold both, harvesting their yields, unless a definitive clear winner emerges over time. For investors looking for this blend of growth and substantial current cash flow, both QDVO and Kleq deserve a deep, serious look.
💡 Frequently Asked Questions (FAQ)
Q1: Since these funds use actively managed covered call strategies, can they ever significantly outperform the NASDAQ 100 during a parabolic bull market?
A1: Paradoxically, covered call funds rarely outperform during extreme upside moves because selling call options ‘caps’ their upside on specific holdings. However, if the active management makes superior, concentrated stock selections (like QDVO holding high-performing names not in the index), they can still generate higher total returns through that outperformance, even with the options strategy drag.
Q2: Should I trust high estimated Return of Capital (ROC) figures when making an investment decision based on tax efficiency?
A2: Absolutely not. Estimates (like QDVO’s 19 A1 filings) are just that—estimates. The composition of distributions can change dramatically before final forms are issued. As Danny noted, the final 2024 form for QDVO showed vastly different ROC data than the estimates. Rely only on final tax forms (like 1099s) and audited financial statements for tax planning.
Q3: Kleq (KQQQ) is hyper-concentrated with 15-25 active holdings. Does this extreme concentration increase risk during a tech downturn?
A3: Yes, significantly. While active stock selection and concentrated positions can maximize returns when the chosen companies perform well, it amplifies the downside risk if one or two major holdings drop or if the whole tech sector corrects. The use of protective puts in Kleq’s strategy is designed to mitigate some of this downside, but the risk remains much higher than a diversified, passive index fund.