A year ago, the Harvest Diversified High Income Shares ETF, better known by its ticker HHIS, was one of the most exciting tech-focused income vehicles on the market. It promised a powerful yield, access to the biggest names in innovation, and a strategy that seemed to offer the best of both worlds: growth potential and consistent cash flow. For a growth-and-income investor looking to simplify their portfolio, HHIS check a lot of boxes on paper. A Sub to the channel is the best way to hold on to future content. But now that the fund has officially passed its one-year anniversary, we have the data to ask the tough question: has HHIS lived up to all that hype, or did the massive yield come at too high a cost?
Fasten your seat belts, folks; this is going to be a fascinating breakdown of how this aggressive income strategy really performs in the wild.
Beyond the Headline: Understanding What HHIS Really Holds
When you first glance at HHIS, you might be tempted to treat it like a traditional, pure-play technology ETF. The headline numbers suggest massive tech exposure, and many investors jump in for exactly that reason. But once you move past that surface-level narrative, things tend to get interesting. While the vast majority of the portfolio is still absolutely driven by tech and innovation leaders, a crucial 10% to 15% of the portfolio sits entirely outside that sector. Living in California, I’ve seen firsthand how quickly tech hype can cycle, and having Eli Lilly and Costco in this mix provides a necessary cushion.

This subtle level of diversification actually matters more than it might seem, particularly in volatile markets. Eli Lilly, for example, comes in as the top holding in the entire fund at 7.5%—hardly a tech stock by traditional definitions. Instead of moving completely in sync with the ups and downs of the tech sector, HHIS is a bit more tied to the broader market. You still get that explosive growth potential when tech leads the pack, but you also have defensive parts of the portfolio that can hold up, rotation after rotation. In a world where leadership shifts quickly, that kind of balance can make a massive difference in your peace of mind and, ultimately, your long-term success.
The Breakdown: Who is Inside the Portfolio?
So, how does the rest of the HHIS portfolio shake out? To really understand how this income is generated, we have to recognize that HHIS is another one of these ‘fund of funds’. It doesn’t hold the individual shares of these companies directly; rather, it holds a selection of other Harvest High Income Shares single-stock ETFs (many of which are newer products). Looking inside, you see a well-balanced spread across multiple companies, with most positions sitting in a range of roughly 5% to 7% of the total assets. This overall structure matters deeply because it means no single name is completely driving the outcome.
HHIS Top Ten Holdings (Roughly Balanced):
- Eli Lilly (Top Holding, 7.5%)
- Apple
- Broadcom
- Google (Alphabet)
- Nvidia
- Tesla
- Amazon
- Meta
- AMD
- Costco (Rounding out the top ten)
A Sub to the channel is the best way to hold on to future content.
Inside the Income Engine: The Mechanics of 30% Yield
This diversification is nice, but it’s not the primary draw of HHIS. The question on everyone’s mind is how a fund holding these massive blue-chip companies can pay out a yield this high. This isn’t free money, and it’s not coming purely from dividends. It is being intentionally and aggressively generated by complex financial instruments.
This strategy of actively rewriting the growth of your favorite tech companies into consistent cash flow involves two major levers that investors need to understand. Living in California, where so many people’s wealth is concentrated in equity, I appreciate the need for cash flow, but the cost of achieving that must be calculated.
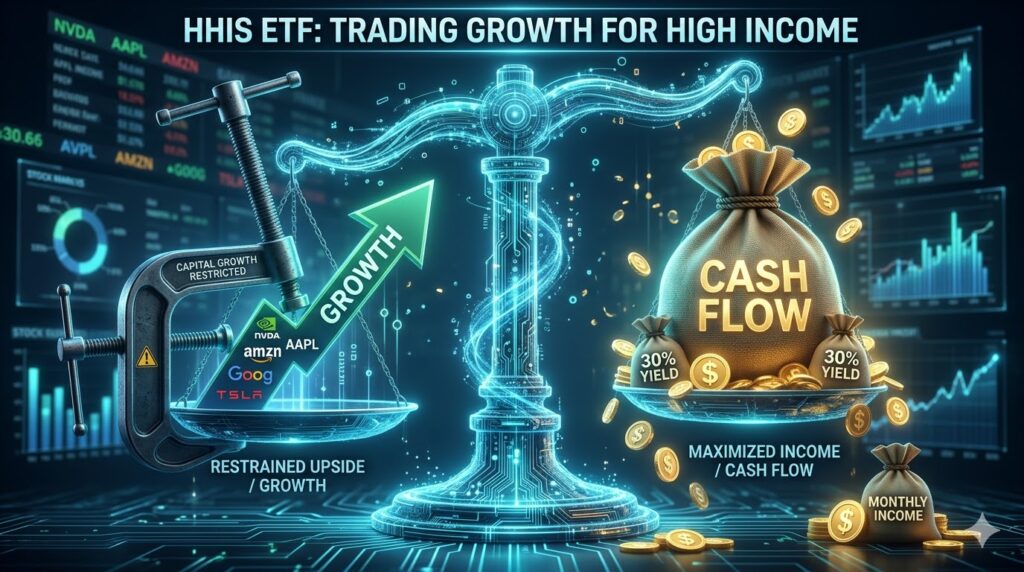
H3: Lever 1: The Covered Call Strategy (up to 50% write)
First, the fund uses a covered call strategy. This means they are essentially selling call options (or standardized derivatives) that allow other investors to buy the shares of the underlying stocks at a pre-set price by a specific date. They collect a premium (income) for selling this right, which helps boost the fund’s yield. The key distinction here, however, is that they do not sell covered calls on the entire portfolio—only on up to 50%.
The fund is actively making a tradeoff: they are collecting massive income (up to 30.06% yield!), but by doing so, they are giving up a significant amount of the potential upside price appreciation in that half of the portfolio if those stocks suddenly shoot up. This is why the fund’s price has fallen recently—they are missing that explosive growth to generate the yield. This strategy is precisely what is being visualized by the clamp on growth in Image 2.
H3: Lever 2: The Leverage Aspect (roughly 25%)
Second, and perhaps less discussed, is that HHIS employs a leverage strategy, currently sitting at roughly 25%. This means they are effectively borrowing money to buy more shares, which multiplies both the dividend income and, crucially, the potential covered call premiums they can generate. This leverage magnifies the income and can boost returns in a rising market, but it also magnifies losses if the market turns. This leverage adds a layer of risk that pure-play tech funds do not have, making HHIS an inherently more aggressive investment.
H3: The Monthly Dividend Breakdown
This strategy leads to a monthly distribution of 27 cents per unit, which is incredibly aggressive. If you want strong, consistent cash flow and are willing to sacrifice significant upside to get it, HHIS absolutely has a place. But for those trying to fully participate in the growth of the tech sector, this monthly distribution comes with a serious warning sign.
A Sub to the channel is the best way to hold on to future content.
The Tally: Numbers Don’t Lie (But They Do Tell Stories)
We have the structure, and we have the mechanics. Now, we have to look at the hard numbers. As of the time of recording, HHIS has been live for just over one year. The current price is coming in at $10.78 with a Net Asset Value (NAV) of $10.76. This close gap between price and NAV shows the fund is trading efficiently. What is perhaps more impressive is that the Assets Under Management (AUM) are already at $1.31 billion, a testament to the popular desire for this type of high-yield income product among investors.
Analyzing the Fees
When we talk about any high-yield fund, we have to talk about fees. Technically, the management fee on HHIS itself is zero. However, because this is a ‘fund of funds’, they pass on the underlying management fees. Since all the underlying Harvest single-stock ETFs have a management fee of 0.40%, effectively that is the management fee on this one. For a diversified, derivative-based fund, a 0.40% effective fee is actually quite competitive. Keep in mind, though, we do not yet have a management expense ratio (MER) for this fund since it just passed its one-year anniversary.
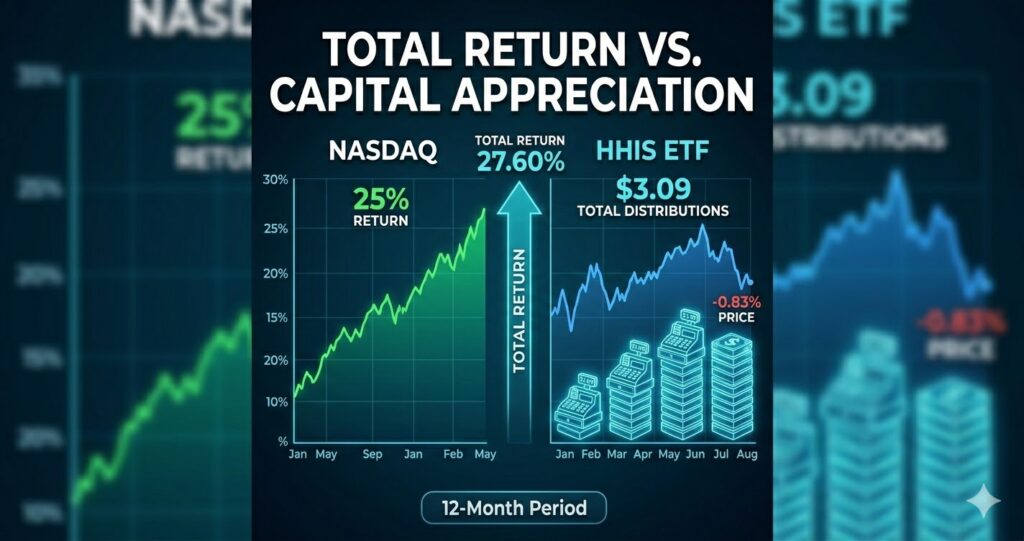
H3: Total Return vs. Benchmark Performance
The most important data point, however, is the comparison against the market. Living in California, I’m constantly surrounded by people tracking the NASDAQ. For this analysis, we will use the NASDAQ return from March 17, 2025, to March 17, 2026, which was just over 25%, as our benchmark. This acts as our de facto yardstick for gauging how HHIS did over that same period.
Here is the showdown:
- HHIS Price Performance: A year ago, this ETF was priced at $10.87. It hit a high of $14.43 before the tech sector became volatile in recent months. Its final price for this period was $10.78, for a price return (ROI) of negative 0.83%.
- The Difference is Income: That negative ROI meant we are leaving it all up to the income to meet our 26% benchmark (once you add in average dividends to that 25% NASDAQ return). Over the year, HHIS received a total of $3.09 in distributions per unit.
- HHIS Total Return: Once we combine that income with the capital depreciation, the total return was 27.60%.
This is the key insight: they not only kept pace with the NASDAQ, they did slightly beat it. This does show that this ETF’s aggression when it comes to their income strategy is 100% meeting its income goals, but it is at a huge cost of that upside.
The Verdict: Cash Flow King or Capital Trap?
So, has HHIS lived up to all that hype? The final answer depends entirely on your goals as an investor. If your goal is to fully participate in the growth of the tech sector, this is probably not the vehicle that’s going to get you there. Living in California, where so many people’s wealth is built on pure equity, I feel that distinction strongly.
HHIS is not trying to beat tech. It is trying to reshape it into consistent cash flow. For investors who want strong, consistent cash flow and are willing to sacrifice significant upside to get it, HHIS absolutely has a place. If you are interested in HHIS, don’t forget to put in a whole heaping helping of due diligence before you place any of your hard-earned money on the table.
H3: Final Takeaway for Tech Income Investors
A year later, we can confidently say that HHIS has been successful at achieving what it set out to do. It converted significant upside growth into a consistent, monthly cash flow, and over its first year, it managed to provide a total return that was slightly higher than its benchmark.
The catch, of course, is that negative ROI. In a flat or down market for tech, this aggressive income strategy could have even steeper capital losses. A year from now, will we be asking if that negative ROI was too high? That remains to be seen. But for now, HHIS has proven it is a powerful (and aggressive) tool for income first, growth second.
Let’s continue that learning journey.
(FAQ)
Q1: What is the main source of the 30% yield in HHIS?
A1: The high yield is generated through a covered call strategy, where the fund sells call options on up to 50% of its holdings, and the use of approximately 25% leverage to amplify returns and income.
Q2: How did HHIS’s performance compare to its NASDAQ benchmark in its first year?
A2: While HHIS experienced negative price depreciation (-0.83%), its total return (including all distributions) was 27.60%, slightly beating the NASDAQ’s total return for the same period.
Q3: Is HHIS a good investment for a pure growth investor?
A3: No. Due to the covered call strategy, HHIS sacrifices a significant amount of capital appreciation. It is designed as an “income-first” vehicle for investors who prioritize monthly cash flow.
🌿 Weekly wellness, health & beauty insights — straight to your inbox
Free subscription · Cancel anytime